In market research, open-ended questions are a double-edged sword: they capture a richness and specificity that’s desirable, but quantifying them is always a challenge because of the ambiguity, semantic variety, and spelling errors they carry. At Moiguer we built our own in-house solution to this age-old problem in opinion surveys, developing our own software to code open-ended responses.
To turn free text into data there’s a process called coding. Someone reads all the responses, groups the ones that say the same thing, assigns a number to each group, and replaces the text with that number in the database. “Hellmanns”, “Jelman”, and “hellmans” all end up under a single code, the one for Hellmann’s.
It’s tedious, repetitive work, prone to consistency errors. When you’re dealing with thousands of responses to multiple questions, across several projects running in parallel, it’s also expensive and inefficient. That was the starting point.
The goal was to increase efficiency (of resources and time) without losing effectiveness (I mean the fidelity of the final result) and, if possible, to increase it.
Two problems, not one
Every open-ended question falls into one of two situations, and each demands a different logic.
When a codebook already exists. In longitudinal studies, panels, or multi-wave projects, the categories were defined in an earlier round. There’s a file (the codebook) with a list of numeric keys and their corresponding values. The task is imputation: take each new response and map it to the right key. The core challenge is spelling variability: “Cocca-cola”, “coca cola”, and “CocaCola” all refer to the same key.
When no codebook exists. In new studies, or questions that have never been asked, the categories have to be coded from scratch. The analyst doesn’t know in advance what they’ll find — they might have a hunch, but if they try to predefine the codebook they risk introducing their own bias over what respondents actually said. First you have to discover what categories emerge from the data, then assign each response to one, and finally produce a reusable codebook for the next waves.
Both flows share infrastructure but solve different things. The distinction matters: imputation follows a pattern that already exists, while coding manufactures one.
Multiple projects, multiple responses
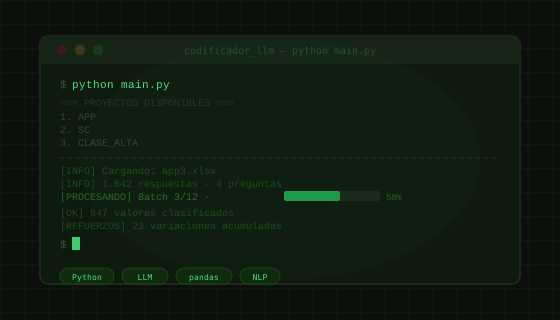
The tool wasn’t designed for a single study. The initial menu lists every project in a central folder, and each one has its own structure: input data, the codebook, learned variants, and results with their checkpoints. Subprojects are detected automatically, and when files follow a wave pattern the tool asks which wave to process. Each project can also have its own special codes.
No matter how clearly a question is worded, as long as questions keep being answered by people with agency of their own, there will always be room for free interpretation (and let’s hope it stays that way), which often means the respondent answers with more than one factor packed into a single response. For example, faced with the question “What do you find most attractive about this product?”, a respondent might answer: “I like its packaging and the variety it offers.” We designed a logic to capture both dimensions, packaging and variety, distinguishing between the top-of-mind or primary driver and secondary ones.
The imputation flow
When the codebook already exists, it comes in as a read-only input. The goal is a single output: the coded dataset.
The system handles the cheap part first: already-seen values come from a cache, and special responses (blanks, “don’t know”, “none”) are assigned by natural language processing rules, without calling any LLM. Only the rest goes to a model, which classifies in batches with high tolerance for typos. Whatever landed in “other” gets a stricter second pass before human review.
That work by the model leaves a valuable residue. Every time it maps a new variation (“cocca-cola” to Coca-Cola), the relationship is saved. On the next run those known variations no longer need the model: they’re resolved in pre-classification. As iterations go by, the system relies less and less on the LLM.
The coding flow
When there’s no codebook, the work is more ambitious and has two outputs: the coded dataset and a new codebook. That codebook is what turns the next wave into an imputation problem.
The split into two steps is deliberate. Done all at once, the model tends to create too many overly specific categories or to group inconsistently across batches. By fixing the category list first, the later assignment works over a constant response space and produces coherent classifications. Between one step and the next, the analyst corrects the list: adding, deleting, renaming, or merging categories.
Frequencies as a quality signal
A model, on its own, doesn’t always detect well what deserves its own category. Among 500 distinct responses, brand A might appear five times in 5 different spellings. Each one looks like a rare case; together they’re a relevant category.
The solution was to pass normalized frequencies along with the values. Before building the request, all the text is normalized (lowercase, no accents, no punctuation), each term’s frequency is counted, and the most frequent ones go to the model.
Interactivity isn’t a flaw, it’s the product
Full automation was never the goal. What we achieved is an effective, efficient tool that eases the analyst’s work while guaranteeing higher-quality grouping.
Before classifying, they can edit the proposed categories. After classifying, they can review each category and move misassigned values. Before saving, they see the full distribution with frequencies and percentages. The model removes the mechanical work; the analyst brings the judgment.
This project reflects how data science, software development, and market research intersect to close the gap between the voice of users and the insights brands need. If you’ve faced the same challenge in text processing, I’d like to hear which approaches worked for you.